|
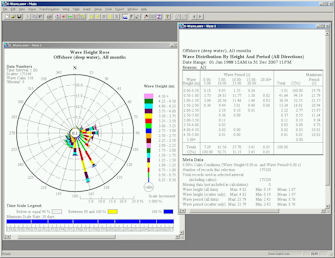
X-Wave is a software tool used for the presentation and analysis of wave and wind time series data sets. Its primary functions include:
- Transform deep water wave climates to user specified depth using linear refraction
- Rose Plot: present time series wave and wind data in rose format.
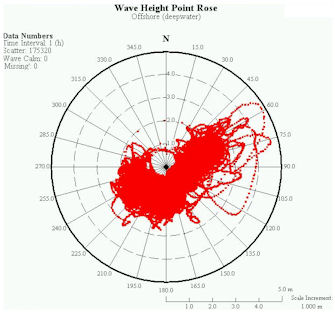
- Splatter Plot: present time series wave and wind data in splatter format.
- Time Series Plot: present time series data in x-y plots
- Accumulated Frequency plot: present the frequency analysis results in bar format
- Scatter Diagram: present time series wave and wind data in tabular frequency distribution format.
- Storm Listing: generate lists for wave height and/or surge that exceed user-specified threshold values for any temporal scale in the time series
All graphic displays can be printed and saved as digital files for reports and presentations. X-Wave can read
time series data in any text format using the Text Import Wizard, including WIS files from the USACE.
 Download PDF brochure
|